XYZ Analysis
XYZ analysis classifies SKUs by forecastability—X is stable, Y is variable, Z is erratic—helping you tailor inventory strategies and reduce planning noise.

While ABC analysis categorizes SKUs based on sales value or volume, XYZ analysis classifies them based on how predictable their demand is over time.
Here’s the core idea:
- X = High forecastability (Stable Demand)
- Y = Medium forecastability (Some variability)
- Z = Low forecastability (Highly erratic or intermittent demand)
How Does It Work?
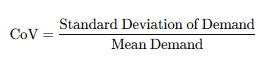
XYZ analysis typically uses a statistical metric like the Coefficient of Variation (CoV), which is calculated as:
You then apply thresholds (which you can tailor to your business) like:
| Class | CoV Range | Demand Behavior |
|---|---|---|
| X | < 0.5 | Very stable, easy to forecast |
| Y | 0.5–1.0 | Moderately variable |
| Z | > 1.0 | Highly erratic or intermittent |
What Does Each Category Mean in Practice?
🔹 X-Class SKUs (Predictable Demand)
- These are your core products.
- Demand is steady over time—seasonality might exist, but is predictable.
- Great candidates for make-to-stock, auto-replenishment, and high service levels.
Best Practice:
Automate replenishment using tight safety stock policies. Focus on optimizing inventory turns.
🔹 Y-Class SKUs (Moderately Variable)
- Some fluctuations in demand—possibly due to promotions, seasonality, or regional variance.
- Requires manual forecast overrides, layered with statistical models.
Best Practice:
Use collaborative forecasting (e.g., sales + ops input), and apply scenario planning for peak periods.
🔹 Z-Class SKUs (Unpredictable / Low Forecastability)
- Lumpy, intermittent, or low-volume demand.
- Typically found in spare parts, NPI (new product introductions), or long-tail catalogs.
Best Practice:
- Avoid make-to-stock.
- Use make-to-order or on-demand production.
- Apply minimum safety stock or de-stock entirely if non-essential.
Why Is This Useful for SKU Complexity?
XYZ analysis helps you stop treating every SKU like it deserves a full stocking strategy.
By knowing which SKUs you can predict and which you can’t, you can:
- Tailor inventory policies (e.g., different safety stock rules)
- Reduce overstocking of unpredictable SKUs
- Improve forecast accuracy at the aggregate level
- Drive rationalization conversations with data
Combine with ABC Analysis
When you combine ABC (revenue) and XYZ (forecastability), you get a powerful 3x3 matrix like this:
| X (Predictable) | Y (Variable) | Z (Erratic) | |
|---|---|---|---|
| A | 🔥 High priority | 🤔 Watch closely | ❗ Risky but important |
| B | ✅ Easy to manage | ⚠️ Needs attention | ❌ Consider phase-out |
| C | 📦 Stock lightly | 📉 Use demand triggers | 🚫 Kill or MTO |
This matrix helps you quickly identify:
- Which SKUs deserve automation and high availability (AX)
- Which ones need human review (BY, AY)
- Which might need to be pruned or shifted to on-demand (CZ, BZ)